Autonetics Metrology Suite is designed to give the user a graphic representation of results and tolerance trends at a glance, via a NEMA 4x analog resistive touchscreen monitor, designed for tough environments. Even if you never open the manual our easy-to-use interface makes accessing detailed measurements and 3-D models streamlined and simple. A navigation and status bar, located at the bottom of each screen, allows the user to quickly review, save or enter data.
bottom of each screen, allows the user to quickly review, save or enter data.
The Home screen continually updates with the latest results in color coded bar graphs that can be viewed and understood at a distance. Production information can be recorded, parts families selected or detailed results exported for review.
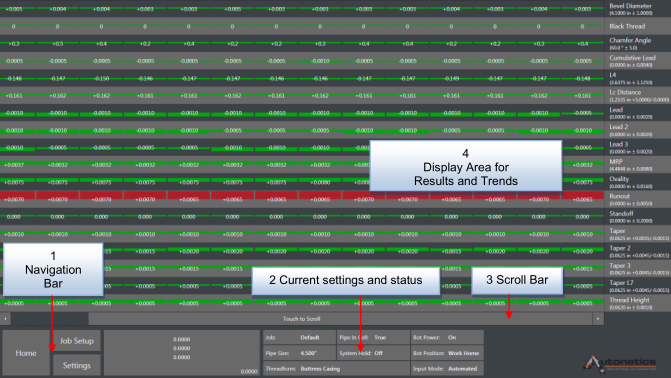
The Home Screen provides navigation buttons to select Home, Job Setup and Settings (1), displays current settings and status of the system (2), Bar to scroll through results (3) and displays results and trends of latest scans (4)
Autonetics Metrology Suite is tailored for each customer making job setup a snap. With pre-configured drop down menus, prompts and text boxes the operator or inspector can enter data by simply touching the text box and selecting the part they wish to run. Autonetics Metrology Suite can even auto detect the part by performing a preliminary scan and matching key dimensions to preloaded work pieces. Production information, heat numbers, batches or shift information can be entered into the log using the on screen keyboard.
The results section of the home screen can be configured as a color bar without results overlay, measurement results or tolerance variation. Trends are shown for each call out in horizontal lines with individual work piece results in vertical lines. This native layout permits anyone to instantly interpret production quality status without any training. The list of callouts are customized for each end user, however the format and functionality remains consistent.
Color and position graphically displays trends and status. As the results of each scan approach the upper/lower bands of specified tolerance limits, the color bar extends from the center of the callout row, above for over size and below for under size. The colors Green and Yellow represent a certain percent of the allowable tolerance. This percentage is set by the administrator. When the tolerance threshold is reached the entire color bar becomes Red.
Drilling Down for Details
The results portion of the Home Screen also allows the user to view complete, in-depth results and profile options for an individual part. To activate the Details window simply touch any portion of the color bar, vertical column, representing the part scan of interest. This window will expand the bar column while keeping the preceding and following samples to the left and right of the window. Use the bar located to the right of the window to scroll through the results.
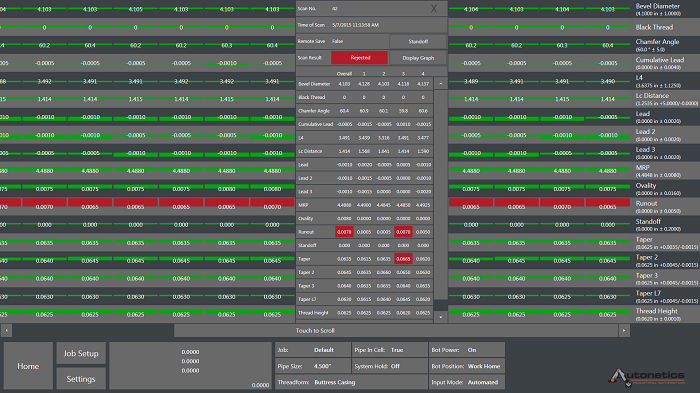
Information in this window includes:
• Scan Number, the scan number designates order in sequence from the value entered in part counter at setup.
• Date and Time Stamp
• Remote Save, shows status of data sent to the required SPC, Server or CNC.
• Acceptance or Rejection results
• Display Graph, portal to individual profile graphs and profile overlays.
• Listing of up to 100 Callouts
• Overall Results, calculation for individual passes / planes in the inspection cycle.
• Raw Measurement Data
• Individual results for each pass / plane in the inspection cycle.
• Reject Reason(s)
3-D Part Models
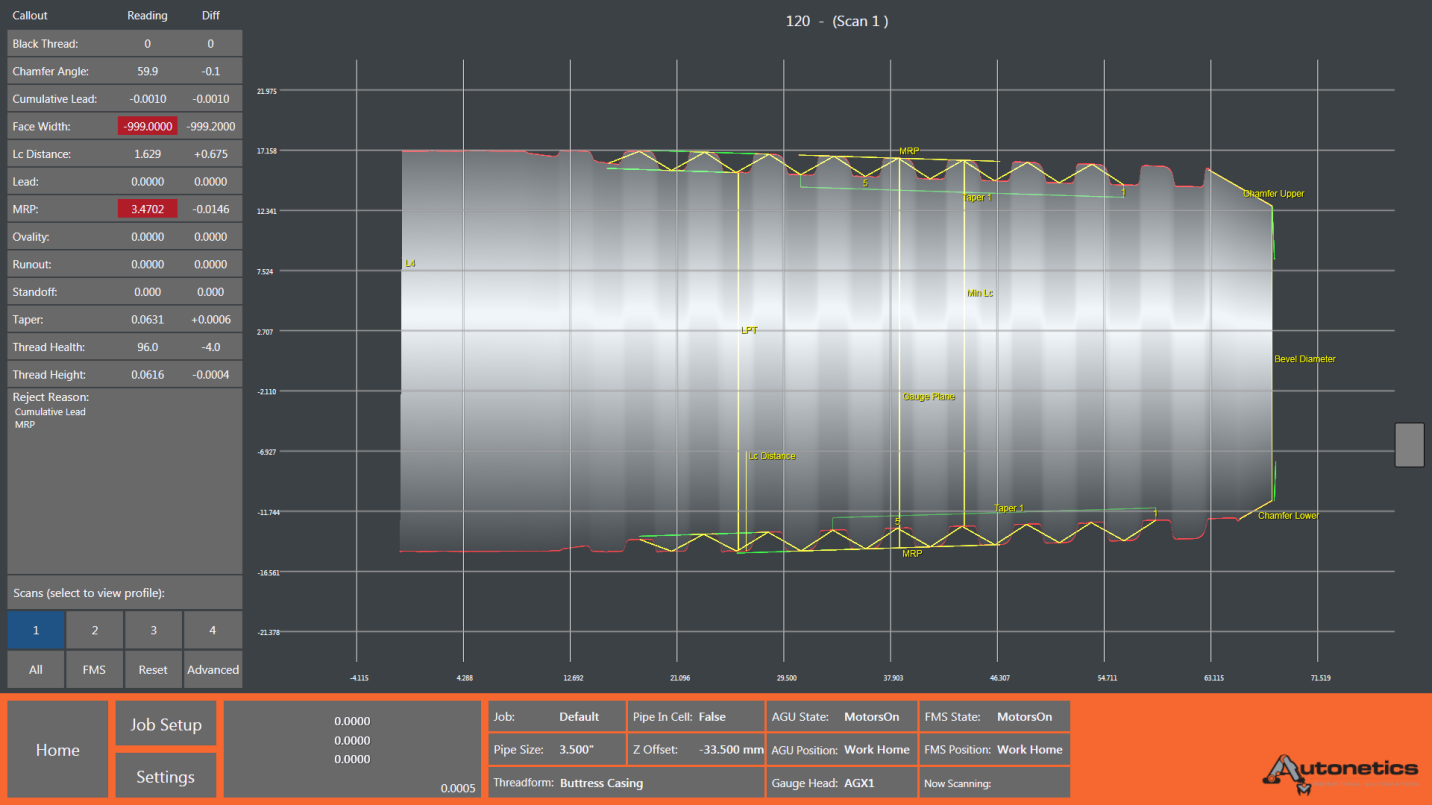
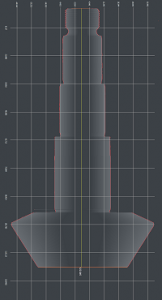
Autonetics Metrology Suite can present results as a profile graph. Similar to an optical comparator but on a scale where the optical comparator is two stories tall. Access to the thread profile graphics is provided in the Details window. The Profile window may be accessed at any time during the inspection cycle and when the Details window is open. When a scan is selected the image is displayed on a Scalable Grid System (SGS). The top and bottom profile lines are presented in red and consist of thousands of measurement points to create a one to one perspective of the part height to length that can be measured on the screen using the SGS. The diameter has been adjusted by removing a section lengthwise from the center to allow the profile graph to better fit the screen. The SGS corrects for missing center section. The locations of designated callouts are exhibited based on the parameters specified by the end-user. The graph can be maximized or minimized using the sliding button on the right side of the screen. Move the Zoom button down to minimize and up to maximize.
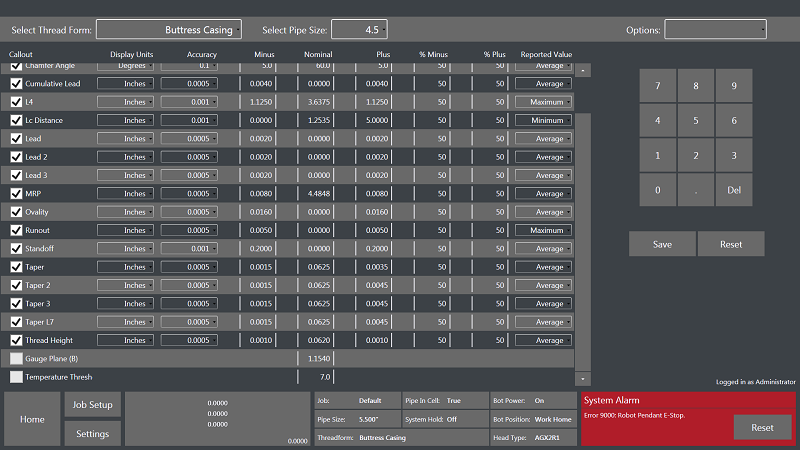
The settings portion of AMS is password protected to allow administrative functions by authorized personnel. Values for callouts are entered here in protected screens, adjustments in tolerance percentages for trend displays can be made as well as setting pass / fail thresholds, unit measurements selected, reported values and temperature thresholds for automated calibration set.
This is only a snapshot of Autonetics truly capable Metrology Suite 5.0, developed and supported in the USA. for more information about our AGU and SGU gauges using AMS 5.0 software please contact us at sales@autonetics.com.


